Image Details
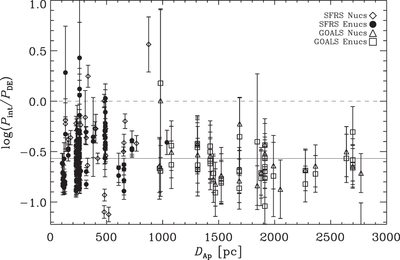
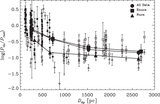
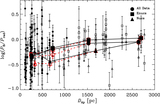
Caption: Figure 9.
Logarithmic ratios of the total internal-to-dynamical equilibrium pressures plotted as a function of aperture diameter in physical units. The dynamical equilibrium pressures are estimated via a linear interpolation using the measured SFR surface densities and the correlation between ΣSFR and P DE found by Sun et al. (2020). Subsets of the sample are identified using different plotting symbols. The dashed line indicates a ratio of unity, while the solid line illustrates the median ratio. Neglecting any additional pressure term associated with turbulent motions of the gas, only ≈5% of the star-forming regions appear to be overpressurized relative to the dynamical equilibrium pressure, each of which are measured on ≲1 kpc scales.
Other Images in This Article
Copyright and Terms & Conditions
© 2022. The Author(s). Published by the American Astronomical Society.