Image Details
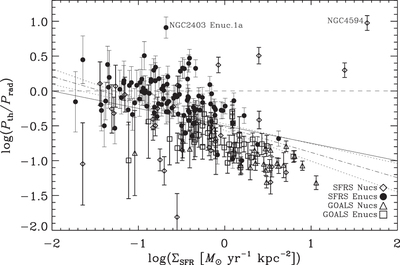
Caption: Figure 4.
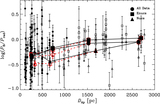
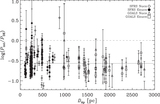
Logarithmic thermal gas-to-radiation pressure ratios plotted as a function of SFR surface density. Subsets of the sample are identified using different plotting symbols. The dashed line indicates a ratio of unity. The thin solid line illustrates the expected trend given the correlated nature of the axes, as they both rely on the photometric aperture diameters. The two sources having thermal gas-to-radiation pressure ratios ≳5 are labeled: the nucleus of NGC 4594 hosts an AGN (Moustakas et al. 2010); NGC 2403 Enuc. 1a is likely an optically faint SNR (Turner & Ho 1994; Schlegel & Pannuti 2003). A least-squares fit to the data is shown by a dotted–dashed line (along with 1σ uncertainties by the dotted lines), indicating that the decrease in thermal gas-to-radiation pressure ratios with increasing values of ΣSFR is only marginally steeper than what is expected given the correlated nature of the axes.
Other Images in This Article
Copyright and Terms & Conditions
© 2022. The Author(s). Published by the American Astronomical Society.