Image Details
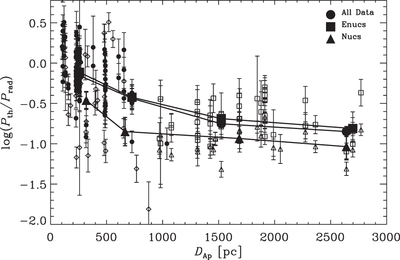
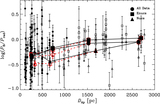
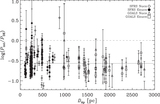
Caption: Figure 5.
Logarithmic thermal gas-to-radiation pressure ratio plotted as a function of aperture diameter in physical units. Subsets of the sample are identified using different plotting symbols: SFRS nuclear regions (open diamonds); SFRS extranuclear regions (filled circles); GOALS nuclear regions (open triangles); and GOALS extranuclear regions (open squares). Running medians for all regions, as well as all nuclear and extranuclear regions, are shown by solid lines using large filled circles, triangles, and squares, respectively. The thermal gas-to-radiation pressure ratios appear to decrease with increasing physical size of each region, indicating that the thermal pressure (i.e., free–free emission) is more centrally peaked on individual star-forming regions than the radiation pressure (i.e., infrared emission).
Other Images in This Article
Copyright and Terms & Conditions
© 2022. The Author(s). Published by the American Astronomical Society.