Image Details
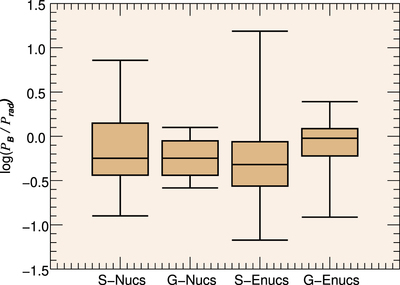
Caption: Figure 7.
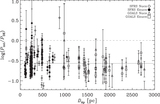
A box and whiskers plot illustrating the minimum, lower quartile, median, upper quartile, and maximum values for the logarithmic ratio of magnetic-to-radiation pressures for the SFRS and GOALS nuclear and extranuclear regions. The median ratios are quite similar for the nuclear regions in both the SFRS and GOALS galaxies, however the ratio for the extranuclear regions in the GOALS galaxies is a factor of ∼2 larger than that for the SFRS extranuclear regions.
Other Images in This Article
Copyright and Terms & Conditions
© 2022. The Author(s). Published by the American Astronomical Society.
Copyright ©
2025 Astronomy Image Explorer. All Rights Reserved.