Image Details
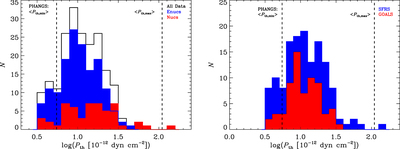
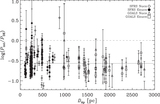
Caption: Figure 3.
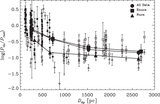
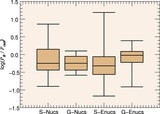
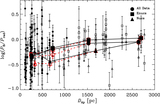
Left: thermal gas pressure distribution for all sources, along with the distributions for nuclear and extranuclear regions. Unlike what is seen for the radiation pressure distributions, the thermal gas pressure estimates for the nuclear and extranculear regions are, on average, quite similar. Right: thermal gas pressure distributions for regions within the SFRS and GOALS galaxies. The thermal gas pressure distributions for regions within the SFRS and GOALS galaxies are quite similar. The vertical lines in both figures indicate the minimum and maximum thermal gas pressure estimates averaged over a sample of HII regions measured on ∼50–100 pc scales by Barnes et al. (2021), indicating that our measurements largely fall between their extreme average values.
Other Images in This Article
Copyright and Terms & Conditions
© 2022. The Author(s). Published by the American Astronomical Society.