Image Details
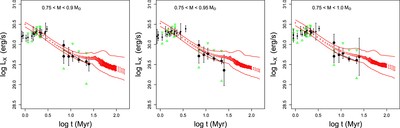
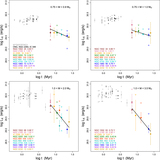
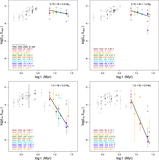
Caption: Figure 9.
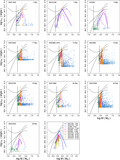
Comparison with the modeling results of Johnstone et al. (2021a). Temporal evolution of the 25%–50%–75% quartiles for the X-ray luminosity in three mass bins. The mass ranges are given in figure legends. Our empirical points from the current study, as medians with 68% confidence intervals (black points with error bars) and 25%–75% quartiles for N > 20 stellar samples (green triangles), are the same as in Figure 8. For the modeled data of Johnstone et al. (2021a), median and its 68% confidence intervals (red points with error bars) and 25%–75% quartiles (red lines).
Other Images in This Article
Show More
Copyright and Terms & Conditions
© 2022. The Author(s). Published by the American Astronomical Society.
Copyright ©
2025 Astronomy Image Explorer. All Rights Reserved.