Image Details
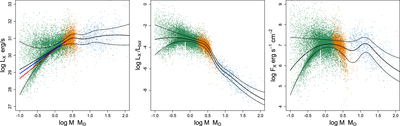
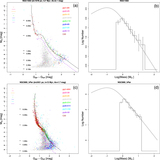
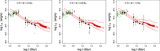
Caption: Figure 6.
X-ray emission quantities as functions of stellar mass for 16, 011 stellar members of the MYStIX/SFiNCs regions. The stars are color coded according to their evolutionary status in the Hertzsprung-Russell diagram: stars on the Hayashi track (teal), Henyey track (orange), and ZAMS or beyond (blue). The black curves are spline fits to the 25%, 50%, and 75% quartiles of the X-ray distribution. In the first panel, the straight lines are regression fits from (COUP; Preibisch et al. 2005) (blue) and (XEST; Telleschi et al. 2007) (red) surveys.
Other Images in This Article
Show More
Copyright and Terms & Conditions
© 2022. The Author(s). Published by the American Astronomical Society.
Copyright ©
2025 Astronomy Image Explorer. All Rights Reserved.