Image Details
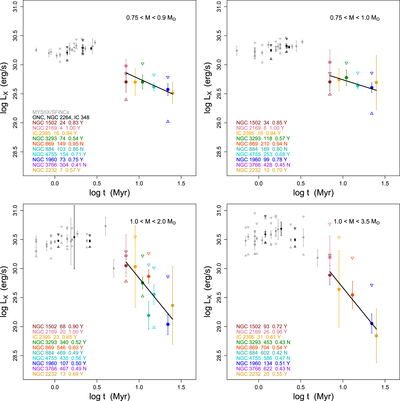
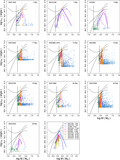
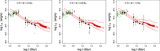
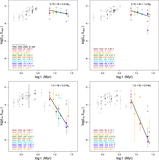
Caption: Figure 8.
Temporal evolution of X-ray luminosity for four mass strata. Corresponding mass bins are given in the figure legends. e-PMS stellar samples from nearby MYStIX/SFiNCs regions are shown as gray points with error bars representing 68% confidence intervals on median (solid squares). The 25% and 75% quartiles are shown for samples with >20 stars (open triangles). Stars from the lightly-absorbed e-PMS subpopulations are marked by black points. The l-PMS open clusters are depicted by colored points with 68% error bars on the 50% quartiles (solid circles) of the KM estimators. The 25% and 75% quartiles are shown only for samples with over 20 stars (open triangles); 25%-quartile KM estimators are often not available due to high numbers of X-ray upper limits. The black lines indicate linear regression fits to the median X-ray luminosities of the open clusters. The regression fit results are listed in Table 7. The legends also list the numbers of stars in the open clusters, whose stellar masses lie within the mass range of interest, and the fractions of X-ray detections. The flag “Y” indicates that the mass completeness limit (Table 1) is below the mass range of interest, the 50% quartile of the KM estimator is available, and the cluster’ median L X is plotted and involved in the regression calculation.
Other Images in This Article
Show More
Copyright and Terms & Conditions
© 2022. The Author(s). Published by the American Astronomical Society.