Image Details
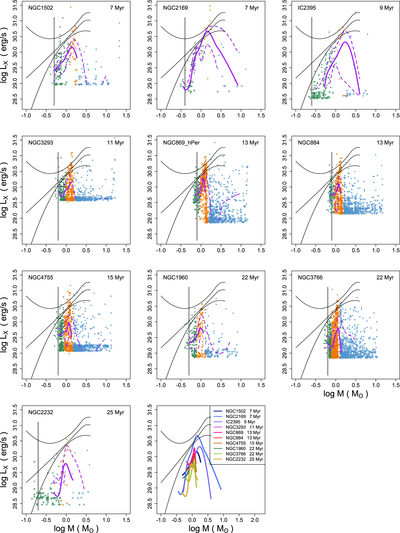
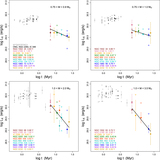
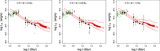
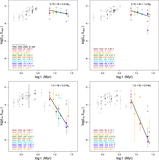
Caption: Figure 7.
X-ray luminosities as a function of stellar mass for members of the 10 open clusters in Table 1. The vertical gray line shows the mass completeness limit for each cluster. The purple curves show smoothed Kaplan-Meier quartiles of the luminosity distributions (see text). The black quartile curves from the MYStIX/SFiNCs surveys are reproduced from the left-hand panel of Figure 6. The last panel collects the median curves from the other panels to facilitate comparison among the clusters.
Other Images in This Article
Show More
Copyright and Terms & Conditions
© 2022. The Author(s). Published by the American Astronomical Society.
Copyright ©
2025 Astronomy Image Explorer. All Rights Reserved.