Image Details
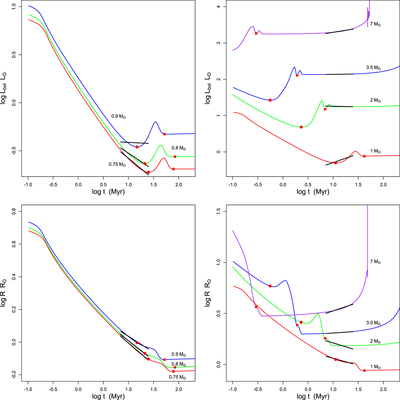
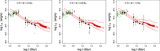
Caption: Figure 1.
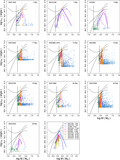
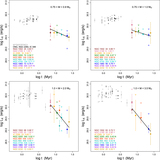
Temporal evolution of stellar bolometric luminosity and radius for seven stellar masses as predicted by the PARSEC 1.2S evolutionary models. The corresponding Hayashi-Henyey and Henyey-ZAMS evolutionary boundaries are depicted by the small circle and square symbols, respectively. The black solid lines indicate linear regression fits to the model data within the t = 7–25 Myr age span of the open clusters of interest in the current study. Corresponding inferred slopes b for the L bol ∝ t b and R ⋆ ∝ t b relations within this age range are listed in Table 7.
Other Images in This Article
Show More
Copyright and Terms & Conditions
© 2022. The Author(s). Published by the American Astronomical Society.