Image Details
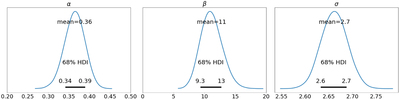
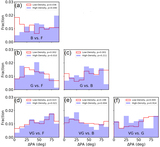
Caption: Figure 19.
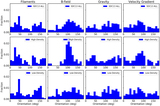
Posterior distributions from Bayesian analysis for I − P relation. The black lines delineate the 68% (1σ) highest-density interval (HDI). α is constrained to be significantly less than 1 with ﹩{0.36}_{-0.02}^{+0.03}﹩, suggesting that aligned dust grains are present within SDC13.
Other Images in This Article
Show More
Copyright and Terms & Conditions
© 2022. The Author(s). Published by the American Astronomical Society.
Copyright ©
2025 Astronomy Image Explorer. All Rights Reserved.