Image Details
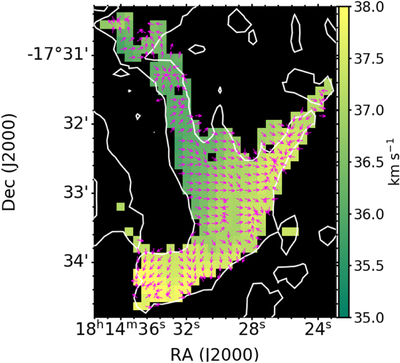
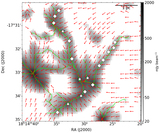
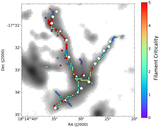
Caption: Figure 6.
NH3 local velocity gradient field overlaid on the centroid velocity map. The local velocity gradients are calculated using the centroid velocity map smoothed to a pixel size of 7″, which is comparable to the pixel size of our POL-2 data. The white contour represents the NH3 integrated intensity of 0.2 Jy beam−1 km s−1. The magenta arrows show the local velocity gradients with constant lengths to emphasize their directions. Near the central hub, the velocity gradients mostly show an east–west direction, while the local velocity gradients in the filament regions are either converging to the local clumps or to the filament ridge.
Other Images in This Article
Show More
Copyright and Terms & Conditions
© 2022. The Author(s). Published by the American Astronomical Society.