Image Details
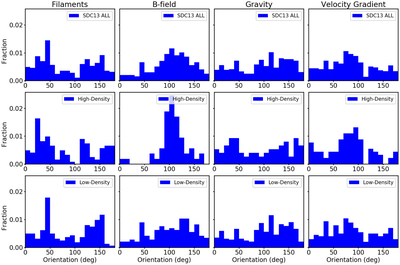
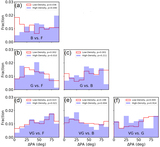
Caption: Figure 7.
Histograms of filament, magnetic field, local gravity, and local velocity gradient directions/orientations (columns) for the entire SDC13 (top), high-density (>250 mJy beam−1; middle), and low-density regions (<250 mJy beam−1; bottom). The fraction shown in the y-axis is the probability density, and thus the integral of each histogram is normalized to unity.
Other Images in This Article
Show More
Copyright and Terms & Conditions
© 2022. The Author(s). Published by the American Astronomical Society.
Copyright ©
2025 Astronomy Image Explorer. All Rights Reserved.