Image Details
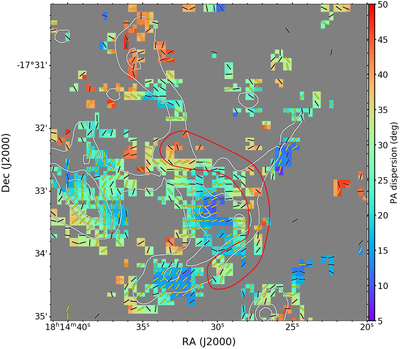
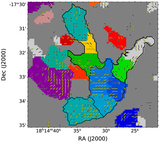
Caption: Figure 3.
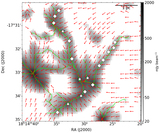
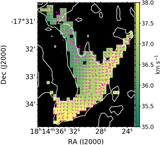
Local magnetic field angular dispersion map shown in color scale. The angular dispersion is calculated using segments within an 18″ radius for each pixel. Pixels with less than three nearby segments are excluded. The white contours are the 100, 300, and 500 mJy beam−1 intensity of the 850 μm continuum. The yellow and black segments display the magnetic field orientations as in Figure 2. The red contour marks the arc-like “U-shape” magnetic field morphology. The magnetic field is relatively uniform within the central hub and individual filaments, leading to small dispersion values. It becomes more disordered near the arc region and around the dense core in the northeastern filament, leading to larger local dispersion values.
Other Images in This Article
Show More
Copyright and Terms & Conditions
© 2022. The Author(s). Published by the American Astronomical Society.