Image Details
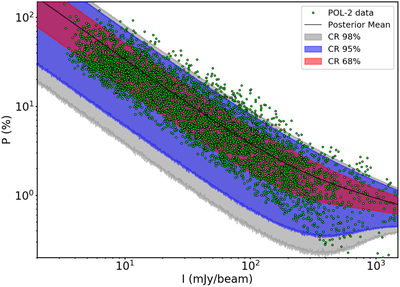
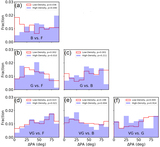
Caption: Figure 18.
850 μm total intensity I vs. polarization fraction P. The green points are the nondebiased, I/σ I > 3, and σ I < 5 mJy beam−1 POL-2 polarization measurements. The colored regions are the predicted I − P distributions based on the Bayesian analysis within the 68%, 95%, and 98% confidence regions (CR). The black line indicates the posterior mean. Most of the data points are within the 98% confidence region of our prediction.
Other Images in This Article
Show More
Copyright and Terms & Conditions
© 2022. The Author(s). Published by the American Astronomical Society.
Copyright ©
2025 Astronomy Image Explorer. All Rights Reserved.