Image Details
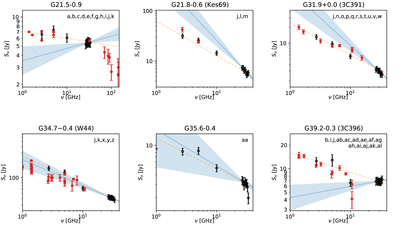
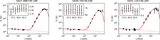
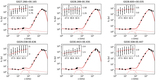
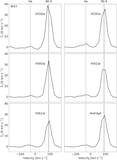
Caption: Figure 7.
SEDs of the six SNRs discussed in Section 5.5 showing extracted flux densities in black, with literature values in red (the references for these points are given on the top right of each plot). Each SED also shows the fitted 2.7–30 GHz power-law model (orange dashed line) and the in-band 26–34 GHz fit (blue line). The in-band spectrum is extrapolated to lower/higher frequencies as a power law, with the blue shaded region showing the associated 1σ uncertainty. Note that for G35.6−0.4 we show the fitted 26–32 GHz spectral index (i.e., without the last two COMAP bands) due to apparent evidence of a spectral break in the in-band spectrum. References: (a) Clark & Crawford (1974); (b) Altenhoff et al. (1979); (c) Milne & Hill (1969); (d) Goss & Day (1970); (e) Reifenstein et al. (1970); (f) Morsi & Reich (1987); (g) Salter et al. (1989b); (h) Salter et al. (1989a); (i) Kassim (1992); (j) Sun et al. (2011); (k) Planck Collaboration et al. (2016c); (l) Velusamy & Kundu (1974); (m) Green et al. (1997); (n) Dulk & Slee (1972); (o) Caswell et al. (1971); (p) Artyukh et al. (1969); (q) Condon (1971); (r) Kesteven (1968); (s) Pauliny-Toth & Kellermann (1966); (t) Bridle & Kesteven (1971); (u) Chaisson (1974); (v) Goss et al. (1979); (w) Moffett & Reynolds (1994); (x) Clark & Crawford (1974); (y) Castelletti et al. (2007); (z) Egron et al. (2017); (aa) Green (2009); (ab) Dickel & Denoyer (1975); (ac) Becker & Kundu (1976); (ad) Becker & Helfand (1987); (ae) Dulk & Slee (1975); (af) Shaver & Goss (1970); (ag) Kellermann et al. (1969); (ah) Reich et al. (1984); (ai) Downes et al. (1981); (aj) Day et al. (1970); (ak) Hughes & Butler (1969); (al) Cruciani et al. (2016).
Other Images in This Article
Copyright and Terms & Conditions
© 2022. The Author(s). Published by the American Astronomical Society.