Image Details
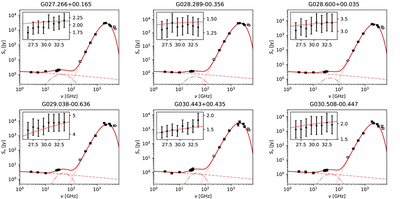
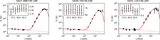
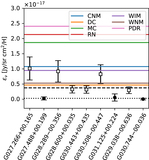
Caption: Figure 5.
SEDs of six H II regions that show a significant AME detection. Filled circles are used in the fit while open circles are not. The free–free, spinning dust, and thermal dust components are shown as dashed, dashed–dotted, and dotted lines, respectively. The total emission model is shown as a thick red line. The inset shown on the upper left of all plots shows the COMAP in-band 26–34 GHz spectrum.
Other Images in This Article

Copyright and Terms & Conditions
© 2022. The Author(s). Published by the American Astronomical Society.
Copyright ©
2026 Astronomy Image Explorer. All Rights Reserved.