Image Details
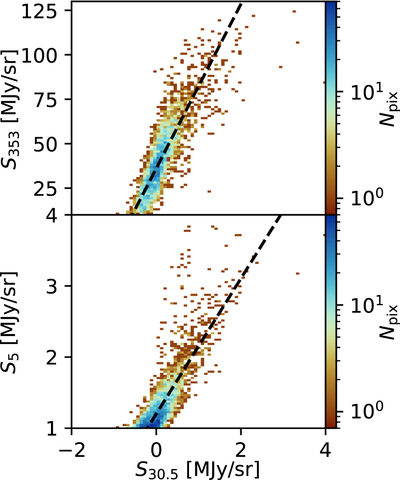
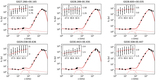
Caption: Figure 3.
Binned T–T plots of pixel brightnesses of the COMAP 30 GHz data with the Parkes 5 GHz (top) and Planck 353 GHz (bottom) data. The dashed line shows the best-fitting linear model, the parameters of which are discussed in Section 5.2.
Other Images in This Article

Copyright and Terms & Conditions
© 2022. The Author(s). Published by the American Astronomical Society.
Copyright ©
2026 Astronomy Image Explorer. All Rights Reserved.