Image Details
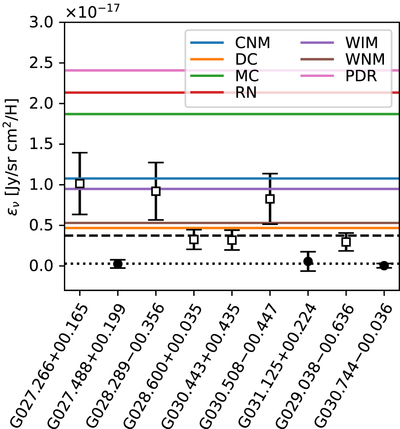
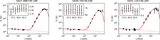
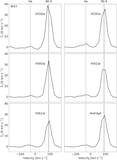
Caption: Figure 10.
Plot of emissivities (calculated using the source sizes in Table 3) of all highlighted sources on the Galactic plane at 30 GHz across the different regions. The colored solid lines represent spinning dust models for a range of typical interstellar environments: cold neutral medium (CNM), dark clouds (DC), molecular clouds (MC), reflection nebulae (RN), WIM, warm neutral medium (WNM), and PDR. Sources categorized as AME or non-AME regions are plotted as white squares or filled circles, respectively. The weighted-average values are shown for the AME (dashed line) and non-AME (dotted line) regions.
Other Images in This Article

Copyright and Terms & Conditions
© 2022. The Author(s). Published by the American Astronomical Society.
Copyright ©
2026 Astronomy Image Explorer. All Rights Reserved.