Image Details
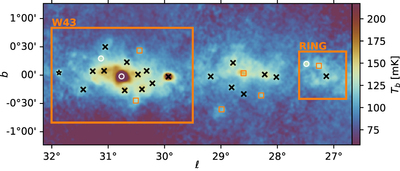
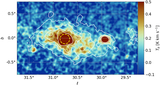
Caption: Figure 2.
COMAP 30 GHz map of W43 showing the locations of sources extracted: H II regions found to fit best to a non-AME model (white circles), H II regions found to best fit a model with AME (orange squares), SNRs (black stars), and other sources detected but discounted from an SED analysis (black crosses). We also mark the W43 region and ring structure (referred to in Section 5.4.1) using orange boxes.
Other Images in This Article

Copyright and Terms & Conditions
© 2022. The Author(s). Published by the American Astronomical Society.
Copyright ©
2026 Astronomy Image Explorer. All Rights Reserved.