Image Details
Caption: Figure 7.
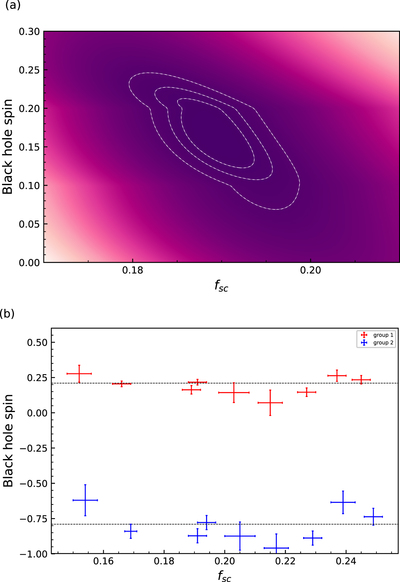
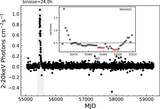
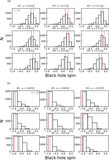
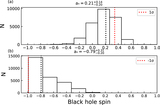
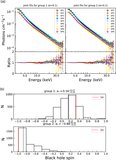
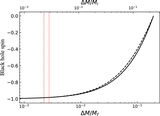
(a) For SP1 under the default Group 1 settings, the contour map of fsc and a*. The three contour lines represent 68.3%, 90%, and 99.7%, respectively. (b) The relation between a* and fsc for SP1 to SP9 in different groups.
Other Images in This Article
Copyright and Terms & Conditions
© 2022. The Author(s). Published by the American Astronomical Society.
Copyright ©
2025 Astronomy Image Explorer. All Rights Reserved.