Image Details
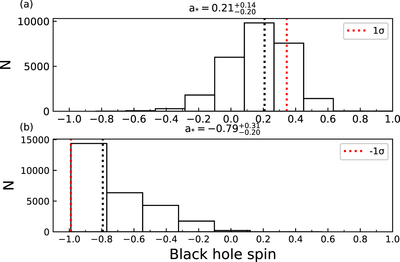
Caption: Figure 5.
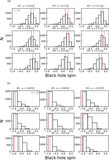
(a) The total histogram of a* for SP1–SP9 for Group 1, which consists of 27,000 data points. (b) The analogous histogram for Group 2. For both (a) and (b), black dotted lines represent the center value of a*, and red dotted lines represent the ±68.3% (±1σ) lower and upper limits between Groups 1 and 2, respectively.
Other Images in This Article
Copyright and Terms & Conditions
© 2022. The Author(s). Published by the American Astronomical Society.
Copyright ©
2025 Astronomy Image Explorer. All Rights Reserved.