Image Details
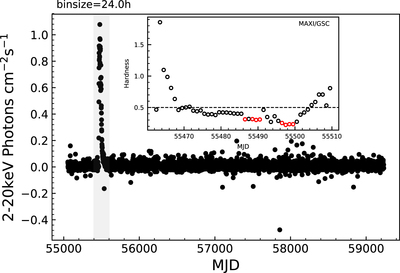
Caption: Figure 1.
The light curve of MAXI J1659-152 over the past 11 yr as observed by MAXI/GSC. The inset shows the evolution of the hardness ratio during the 2010 outburst. The hardness is defined as the ratio of the counts detected at 4.0–10.0 keV (hard X-ray bands) to the counts detected at 2.0–4.0 keV (soft X-ray bands) of MAXI/GSC. The red circles in inset correspond to dates with observations by RXTE/PCA, with two points (SP2 and SP3) overlapping.
Other Images in This Article
Copyright and Terms & Conditions
© 2022. The Author(s). Published by the American Astronomical Society.
Copyright ©
2025 Astronomy Image Explorer. All Rights Reserved.