Image Details
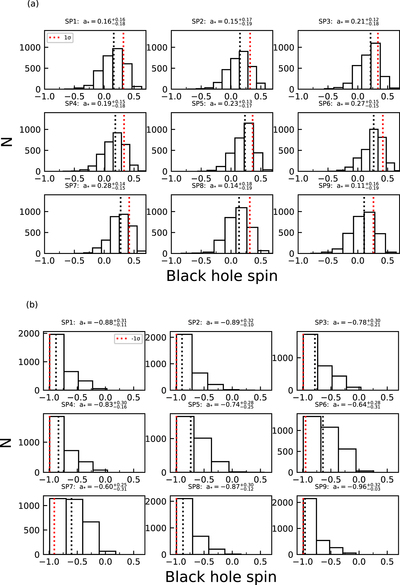
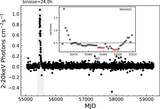
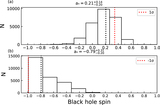
Caption: Figure 4.
(a) The results of MC error analysis of a* for SP1–SP9 for Group 1. (b). The analogous results for Group 2. For both (a) and (b), black dotted lines represent the center value of a*, and red dotted lines represent the ±68.3% (±1σ) lower and upper limits between Groups 1 and 2, respectively.
Other Images in This Article
Copyright and Terms & Conditions
© 2022. The Author(s). Published by the American Astronomical Society.
Copyright ©
2025 Astronomy Image Explorer. All Rights Reserved.