Image Details
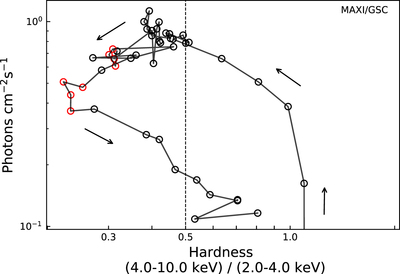
Caption: Figure 2.
The hardness−intensity diagram of MAXI J1659-152 from MAXI/GSC observations. The hardness is defined as the ratio of the counts detected at 4.0–10.0 keV to the counts detected at 2.0–4.0 keV of MAXI/GSC. The red circles above represent the observations by RXTE/PCA that we analyze in this paper, again with two points (SP2 and SP3) overlapping.
Other Images in This Article
Copyright and Terms & Conditions
© 2022. The Author(s). Published by the American Astronomical Society.
Copyright ©
2025 Astronomy Image Explorer. All Rights Reserved.