Image Details
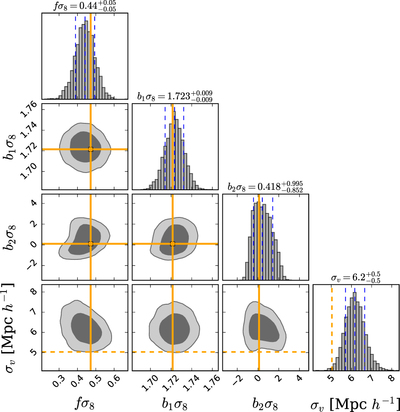
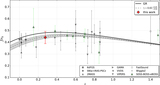
Caption: Figure 7.
68% and 95% posterior confidence regions for the four eTNS parameters fσ8, b1σ8, b2σ8, and σv, obtained from the MCMC modeling of the redshift-space radial and transverse wedges of galaxy clusters in the scale range ﹩10\lt s\left[{\rm{Mpc}}\,{h}^{-1}\right]\lt 80﹩. The vertical dashed blue lines show the first quantiles of the 1D marginalized distributions. The solid orange lines show the Planck 18 fσ8, b1σ8, and b2σ8 predictions, with b1 being estimated by Equation (28) with the Tinker et al. (2010) model, and b2 from Equation (29). The dashed orange lines show the linear-order estimate of the one-dimensional velocity dispersion given by Equation (30).
Other Images in This Article
Copyright and Terms & Conditions
© 2021. The American Astronomical Society. All rights reserved.