Image Details
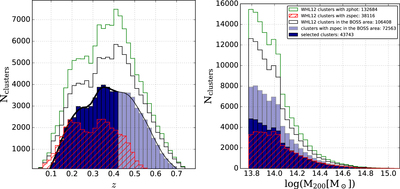
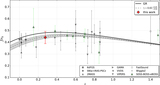
Caption: Figure 2.
The redshift (left panel) and mass (right panel) distribution of the spectroscopic cluster sample analyzed in this work (blue solid histogram in the selected redshift range 0.1 < z < 0.42, cyan histogram at higher redshifts), compared to the redshift distributions of the WHL12 photometric and spectroscopic cluster samples (green and red histograms, respectively) and of the WHL12 sample restricted to the BOSS area (black histogram). The number of selected clusters in each catalog is reported in the label. The black solid line in the left panel shows the smoothed redshift distribution of the random catalog.
Other Images in This Article
Copyright and Terms & Conditions
© 2021. The American Astronomical Society. All rights reserved.
Copyright ©
2025 Astronomy Image Explorer. All Rights Reserved.