Image Details
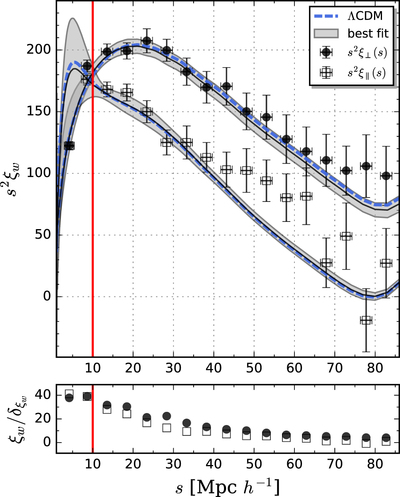
Caption: Figure 4.
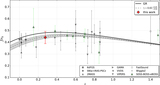
Upper panel: The redshift-space transverse (solid circles) and radial (open squares) wedges of the spectroscopic cluster catalog compared to the best-fit eTNS model, which is the median of the MCMC posterior distribution (black solid line). The shaded areas show the 68% uncertainty on the posterior median. The horizontal error bars are the standard deviation around the mean pair separation in each bin. The vertical error bars show the diagonal values of the bootstrap covariance matrix. The vertical red line indicates the minimum scale used in the fitting analysis. The minor mismatch in the radial wedge at ﹩40\lt s\left[{\rm{Mpc}}\,{h}^{-1}\right]\lt 60﹩ is not statistically significant considering the covariance in the measurements (﹩{\tilde{\chi }}^{2}=0.71﹩). Lower panel: The signal-to-noise ratio, that is the transverse (solid circles) and radial (open squares) wedge values divided by the corresponding standard deviations.
Other Images in This Article
Copyright and Terms & Conditions
© 2021. The American Astronomical Society. All rights reserved.