Image Details
Caption: Figure 1.
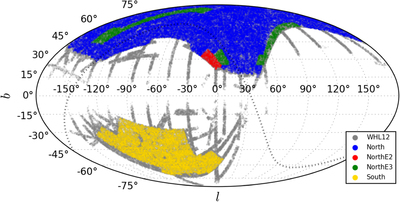
The angular distribution of the spectroscopic cluster sample analyzed in this work, in the north (blue points), north E2 (red points), north E3 (green points), and south (yellow points) fields, compared to the WHL12 photometric sample (gray points, in background). The map is shown in the Galactic Coordinate System. The dotted black line indicates the Celestial Equator.
Other Images in This Article
Copyright and Terms & Conditions
© 2021. The American Astronomical Society. All rights reserved.
Copyright ©
2025 Astronomy Image Explorer. All Rights Reserved.