Image Details
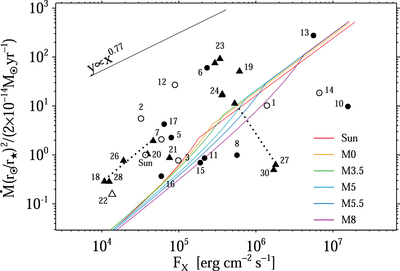
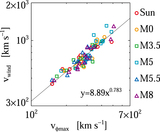
Caption: Figure 23.
Predicted relation between X-ray flux (FX) and the wind’s mass-loss rate (﹩\dot{M}﹩) based on this study (colored curves). The circles and triangles correspond to the observed (FX, ﹩\dot{M}﹩) of M and G, K dwarfs, respectively, where the ﹩\dot{M}﹩ of the stars indicated by open symbols is constrained only by an upper limit. The dotted lines indicate the pairs of binaries. The numbers assigned to the symbols are the ID numbers of the stars used in Wood et al. (2021), and the corresponding star names are listed in Figure 20. Here y ∝ x0.77 is a fitted line derived by Wood et al. (2021).
Other Images in This Article

Show More
Copyright and Terms & Conditions
© 2021. The American Astronomical Society. All rights reserved.
Copyright ©
2025 Astronomy Image Explorer. All Rights Reserved.