Image Details
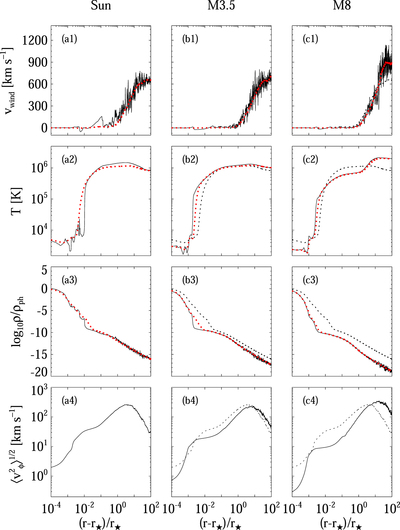
Caption: Figure 3.
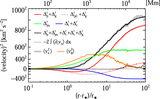
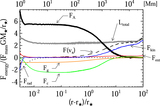
Snapshots of solar and stellar wind profiles about the velocity, temperature, mass density, and temporally averaged profiles of Alfvén wave amplitude. The left, middle, and right columns correspond to the results of the solar wind and the stellar winds of M3.5 and M8 dwarfs, respectively. The results shown here are obtained by setting vph/vconv = 1 and ﹩\mathrm{ln}(\overline{B}/{B}_{\mathrm{ph}})=-5﹩. The red dotted lines show the temporally averaged physical quantities of the stellar wind, while the black dotted lines correspond to that of the solar wind as a function of (r − r⋆)/r⋆.
Other Images in This Article

Show More
Copyright and Terms & Conditions
© 2021. The American Astronomical Society. All rights reserved.
Copyright ©
2025 Astronomy Image Explorer. All Rights Reserved.