Image Details
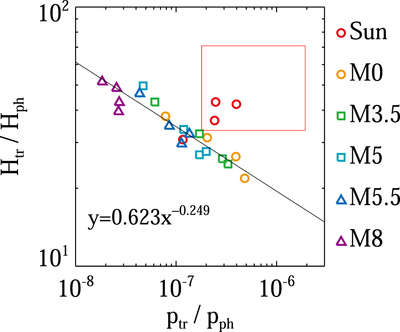
Caption: Figure 6.
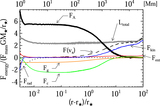
The ﹩{H}_{\mathrm{tr}}/{H}_{\mathrm{ph}}﹩ of various M dwarfs and the Sun as a function of ﹩{p}_{\mathrm{tr}}/{p}_{\mathrm{ph}}﹩. The simulation results shown here are obtained by setting vph/vconv = 1 and ﹩\mathrm{ln}(\overline{B}/{B}_{\mathrm{ph}})=-3,-4,-5,-6﹩. The red rectangle represents the range of observed plasma pressure in the solar spicule (Alissandrakis et al. 2018; Shimojo et al. 2020) and that of the observed spicule height (Pereira et al. 2012; Zhang et al. 2012).
Other Images in This Article

Show More
Copyright and Terms & Conditions
© 2021. The American Astronomical Society. All rights reserved.
Copyright ©
2025 Astronomy Image Explorer. All Rights Reserved.