Image Details
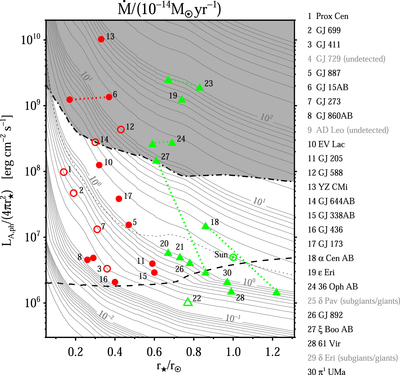
Caption: Figure 20.
The r⋆–LA,ph diagram for mass-loss rate (﹩\dot{M}﹩) with the observed ﹩\dot{M}﹩ of main-sequence stars (Vidotto & Bourrier 2017; Wood et al. 2021). The red circles and green triangles correspond to the positions of (r⋆, LA,ph) to reproduce the observed ﹩\dot{M}﹩ of M and G, K dwarfs, respectively, where the ﹩\dot{M}﹩ of the star indicated by open symbols is constrained only by an upper limit. The red and green dotted lines indicate the pairs of binaries. The numbers assigned to the symbols are the ID numbers of the stars used in Wood et al. (2021), which are listed on the right side of the figure. The star names in gray are not plotted in the figure because they are not main-sequence stars or ﹩\dot{M}﹩ is not detected. The thick black dashed and dashed–dotted lines in the r⋆–LA,ph diagram are the same as those in Figure 18. Thus, the LA,ph in the gray area is impossible to generate even if the velocity of convective motion reaches the sound speed of the stellar photosphere.
Other Images in This Article

Show More
Copyright and Terms & Conditions
© 2021. The American Astronomical Society. All rights reserved.