Image Details
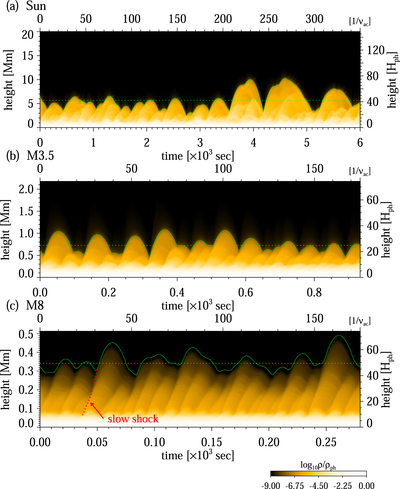
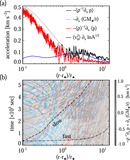
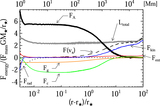
Caption: Figure 5.
Time-slice diagrams of mass density in the lower atmospheres of (a) Sun, (b) M3.5, and (c) M8 dwarfs. The simulation results shown here are obtained by setting vph/vconv = 1 and ﹩\mathrm{ln}(\overline{B}/{B}_{\mathrm{ph}})=-3﹩. The green solid lines represent the contour lines of T = 4 × 10⁴ K (temperature of the top of the chromosphere). The upward and downward motions of the top of the chromosphere correspond to the dynamics of the stellar spicule. The green horizontal dotted lines represent the median height of the transition region (﹩{H}_{\mathrm{tr}}﹩).
Other Images in This Article

Show More
Copyright and Terms & Conditions
© 2021. The American Astronomical Society. All rights reserved.
Copyright ©
2025 Astronomy Image Explorer. All Rights Reserved.