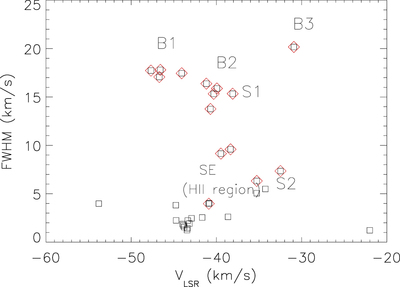
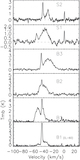
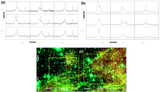
Distribution of LSR velocity and the FWHM at different positions of HB 3, including the FWHMs from representative spectra shown in Figures 9 and 10 in addition to those in Table 5. The first component (in red) are broad lines except in the SE (H II) region.