Image Details
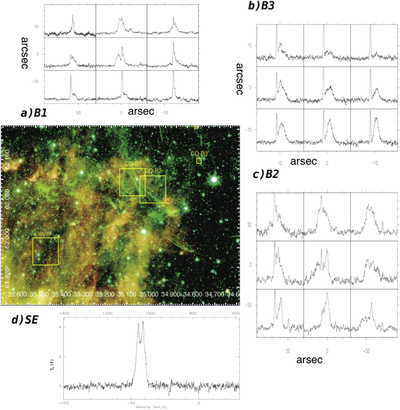
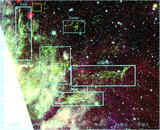
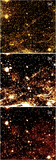
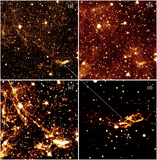
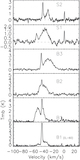
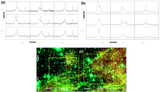
Caption: Figure 10.
Spatial distribution of molecular CO toward the southeast portion of HB 3 and W3 complex (the exact locations are marked as yellow boxes on a large map of HB 3 in Figure 5 and summarized in Table 2). GRID spectra (in panels (a)−(c), which have the unit of arcsec in x- and y-axis like Figures 11(a) and 11b) of CO(3-2) are toward B1 (a), B2 (c), and B3 (b) region. The CO positions (as yellow boxes) are marked on the Spitzer and WISE three-color images (center). Panels: (a) CO(3-2) GRID spectra toward B1 region, with the X-axis velocity from −100 to +30 km s−1 (b) CO(3-2) GRID spectra toward B3 region (the middle of the SNR), with a velocity from −70 to 0 km s−1, (c) CO(3-2) GRID spectra toward the B2 region, velocity ranging from −100 to +30 km s−1. (d) A CO(2-1) spectrum toward SE position (see Table 2) in velocity. The values on the upper side are detector channel numbers.
Other Images in This Article

Show More
Copyright and Terms & Conditions
© 2021. The American Astronomical Society. All rights reserved.