Image Details
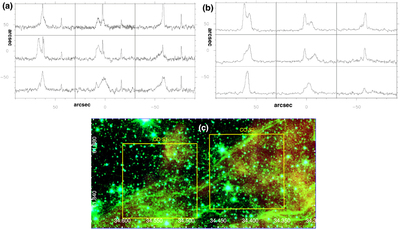
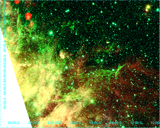
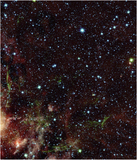
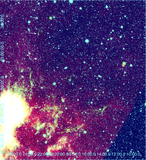
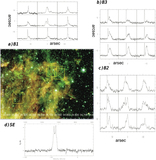
Caption: Figure 9.
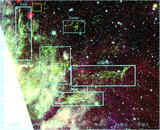
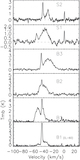
Spatial distribution of molecular CO toward the southern shell (the exact locations are marked as yellow boxes on a large map of HB 3 in Figure 5 in sexagesimal coordinate.) GRID spectra (arcsec in x- and y-axis) of CO(3-2) are toward S1 (a) and S2 (b) regions. The covered FOVs of the GRID spectra are marked on the Spitzer 4.5 μm (in green) and WISE (in red) images (c). For individual CO spectrum in CO-S1 region (a), the x-axis ranges in velocity from −100 to +30 km s−1 and the y-axis from −1 K to 3 K. For individual spectrum in CO-S2 region (b), x-axis is a velocity from −70 to −10 km s−1. The CO broad lines and H2 emission show a spatial correlation, but in the local details, the strongest peaks may differ.
Other Images in This Article

Show More
Copyright and Terms & Conditions
© 2021. The American Astronomical Society. All rights reserved.