Image Details
Caption: Figure 7.
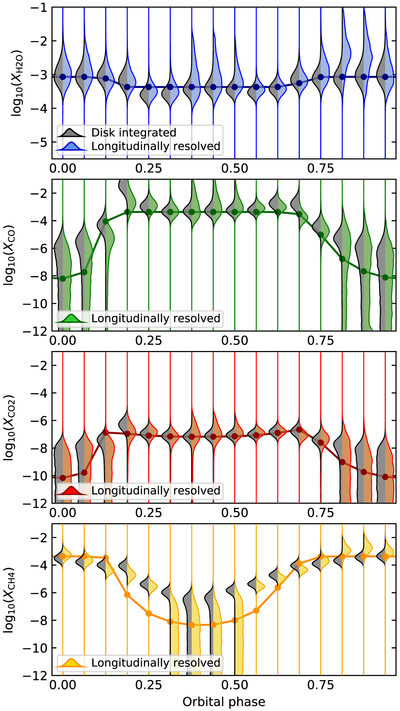
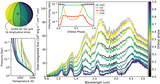
Retrieved WASP-43b volume-mixing ratios of the synthetic WASP-43b JWST phase-curve observation of the variable-composition case (M2). The gray and colored histograms show the posterior distributions of the disk-integrated and longitudinally resolved analyses, respectively, as a function of orbital phase. The marginal posteriors have been smoothed for better visualization. The solid curves with dots denote the input abundances at the subobserver longitudes corresponding to each orbital phase.
Other Images in This Article
Copyright and Terms & Conditions
© 2021. The American Astronomical Society. All rights reserved.
Copyright ©
2025 Astronomy Image Explorer. All Rights Reserved.