Image Details
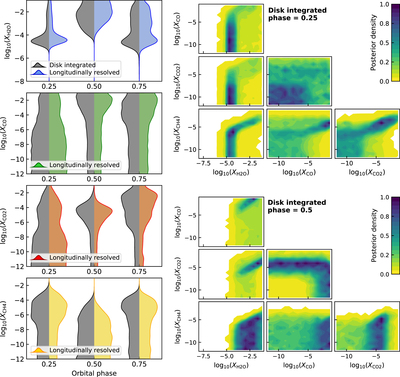
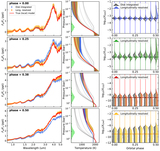
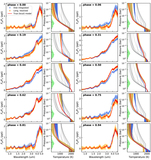
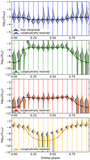
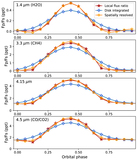
Caption: Figure 2.
Retrieved WASP-43b volume-mixing ratios of the Stevenson et al. (2017) and Mendonça et al. (2018) phase-curve spectra. The left panels show the abundance marginal posterior distributions for the longitudinally resolved (colored) and disk-integrated (gray) analyses at the three orbital phases shown in Figure 1. The marginal posteriors have been smoothed for better visualization. The sets of panels on the right show two examples of the abundance pairwise posterior distributions at orbital phases of 0.25 (top panels) and 0.5 (bottom panels) of the disk-integrated analysis.
Other Images in This Article
Copyright and Terms & Conditions
© 2021. The American Astronomical Society. All rights reserved.
Copyright ©
2025 Astronomy Image Explorer. All Rights Reserved.