Image Details
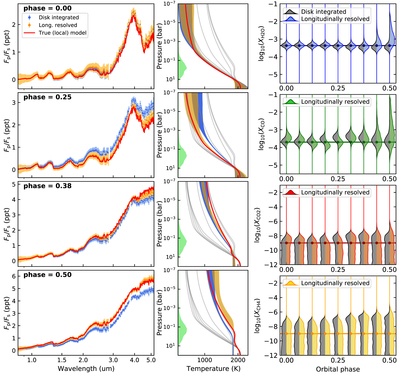
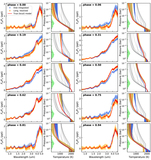
Caption: Figure 5.
Model and retrieval of the synthetic WASP-43b JWST phase-curve observation of the constant-composition case (M1). Left panels: the markers with error bars denote the disk-integrated (blue) and longitudinally resolved (orange) planet-to-star flux ratios at selected phases (from top to bottom, see labels). The red curves denote the spectra generated from a 1D model using the local conditions of the true model at the subobserver longitude of each orbital phase. Center panels: retrieved temperature profiles of the synthetic data sets from the left panel. The blue and orange shaded areas denote the disk-integrated and longitudinally resolved temperature-profile posterior distributions, respectively (central 68% credible interval of the posteriors). The red curves denote the temperature profile at the subobserver longitude of each phase. The gray curves denote the temperature profiles of the true model at all other longitudinal slices. The width of the green curve denotes the relative contribution function at each pressure level for these JWST simulations. Right panels: volume-mixing-ratio posterior distributions for the disk-integrated (gray) and longitudinally resolved (colored) analyses as a function of orbital phase (only shown between transit and eclipse epoch because the model is symmetric). The marginal posteriors have been smoothed for better visualization. The solid curves with dots denote the abundances of the true model.
Other Images in This Article
Copyright and Terms & Conditions
© 2021. The American Astronomical Society. All rights reserved.