Image Details
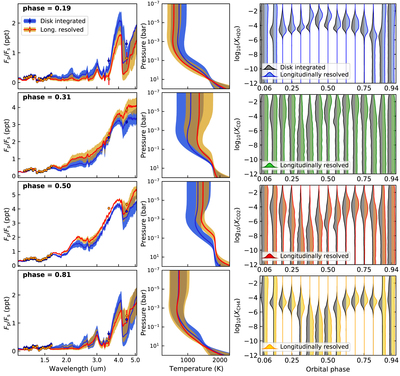
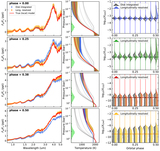
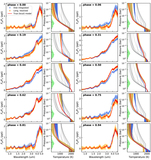
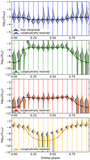
Caption: Figure 3.
WASP-43b retrieval with PYRAT BAY of the Stevenson et al. (2017) phase-curve spectra, following the atmospheric parameterization of Feng et al. (2020). The left and center panels shows the retrieved spectra and temperature profiles at selected phases (see labels) from top to bottom. The solid curves and shaded areas denote the median and 68% credible interval of the posterior distributions for the disk-integrated (blue) and longitudinally resolved (orange) analyses. The colored markers with error bars show the data sets we fit (left panels). The right panels show the abundance marginal posterior distributions for the disk-integrated (gray) and longitudinally resolved (colored) analyses as a function of orbital phase. The marginal posteriors have been smoothed for better visualization.
Other Images in This Article
Copyright and Terms & Conditions
© 2021. The American Astronomical Society. All rights reserved.