Image Details
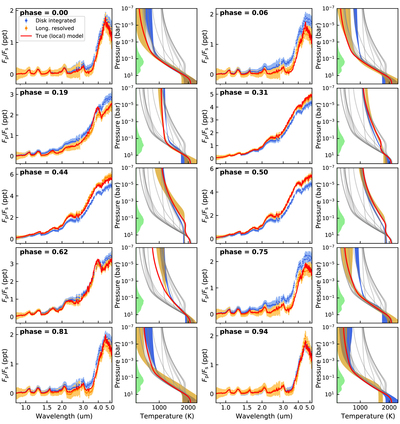
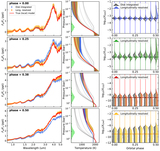
Caption: Figure 6.
Model and retrieval of the synthetic WASP-43b JWST phase-curve observation of the variable-composition case (M2). Each pair of panels show the model spectra and retrieved temperature profiles at selected orbital phases (see labels). The disk-integrated and longitudinally resolved analyses are denoted in blue and orange, respectively. The red curves denote local spectra and temperature profiles at the subobserver longitude of each orbital phase. The gray curves denote the temperature profiles of the true model at all longitudinal slices. The width of the green curve denotes the relative contribution function at each pressure level for these JWST simulations.
Other Images in This Article
Copyright and Terms & Conditions
© 2021. The American Astronomical Society. All rights reserved.