Image Details
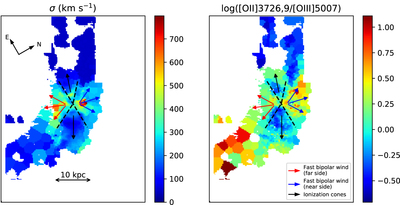
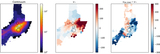
Caption: Figure 16.
Left: velocity dispersion map of ionized gas traced by [O III] 5007 replicated from Figure 7. Right: extinction-corrected map of the [O II] 3726, 9/[O III] 5007 line ratio replicated from Figure 10. The red and blue arrows show the location and direction of the far and near sides, respectively, of the fast bipolar wind. The bipolar wind is in the N–S direction of the previously reported superbubble in RV13 but extends two to three times further in radius to over 5 kpc and has an opening angle of ∼90°. The bipolar wind reaches maximum blueshifted or redshifted velocities of up to 1800 km s−1. The black arrows show the location and direction of the ionization cones and/or the slower outflows. The ionization cones encompass the high [O III] flux outflow regions defined in RZ14. Line ratios in the ionization cones show a mixing of shock plus precursor excitation and AGN photoionization, with an increased contribution from the latter compared with the rest of the galaxy. The ionized gas in the ionization cones shows a velocity dispersion of 150–250 km s−1 and bipolar central velocities of ∼100 km s−1, suggesting possible outflows relatively perpendicular to the line of sight (see Section 4.1 for discussion). The black dashed lines show the separation between the bipolar wind and the ionization cones, centered at the midpoint between the N and SW AGNs.
Other Images in This Article

Show More
Copyright and Terms & Conditions
© 2021. The American Astronomical Society. All rights reserved.