Image Details
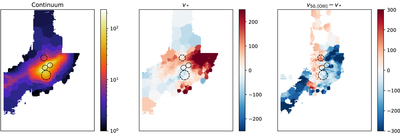
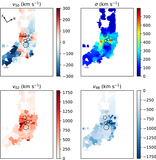
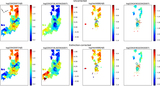
Caption: Figure 8.
Left: Voronoi-binned model flux map for the continuum. The color bar shows the flux in units of 10−16 erg s−1 cm−2. Middle: stellar velocity map. Right: map of [O III] 5007 emission central velocity relative to stellar velocity. The color bars of the middle and right panels show the velocity in kilometers per second. The black dashed circles show the locations of the outflow regions, and the black solid circles show the locations of the superbubbles.
Other Images in This Article

Show More
Copyright and Terms & Conditions
© 2021. The American Astronomical Society. All rights reserved.
Copyright ©
2025 Astronomy Image Explorer. All Rights Reserved.