Image Details
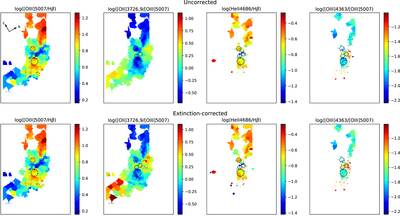
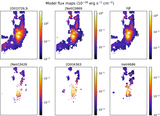
Caption: Figure 10.
Maps of the [O III] 5007/Hβ, [O II] 3726, 9/[O III] 5007, He II/Hβ, and [O III] 4363/[O III] 5007 line ratios before (top row) and after (bottom row) extinction correction. Each column shows a line ratio. The black dashed circles show the locations of the outflow regions, and the black solid circles show the locations of the superbubbles. The line ratios in the central region differ at the locations of the outflows and superbubbles, with the two regions showing opposite line ratio trends. In the outflow region, high line ratios are measured for [O III] 5007/Hβ and He II/Hβ. In the superbubbles, high line ratios are measured for [O II] 3726, 9/[O III] 5007 and [O III] 4363/[O III] 5007. A remarkable feature is that the NE nebula displays similar line ratios as the outflow regions.
Other Images in This Article

Show More
Copyright and Terms & Conditions
© 2021. The American Astronomical Society. All rights reserved.