Image Details
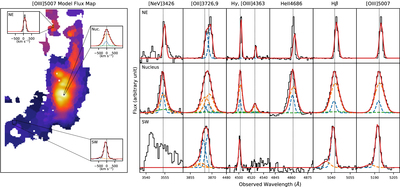
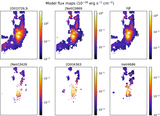
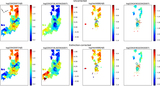
Caption: Figure 5.
Left: Voronoi-binned model flux map of [O III] 5007. The [O III] 5007 velocity profiles of representative Voronoi bins in the NE nebula, nuclear region, and SW nebula are shown in the insets. Right: spectra of each representative Voronoi bin from top to bottom. The emission lines are fitted with a maximum of three kinematic components. In the velocity profiles and spectra, the black line is the continuum-subtracted spectrum, the red line is the total emission line model, and the blue, orange, and green dashed lines are the emission line models for individual kinematic components. The nuclear bin has the broadest velocity profile, followed by the SW bin, while the NE bin has the narrowest profile. The SW exposures are affected by systematic features resulting in broad bumps in the spectra in the proximity of 3500 Å. The [Ne V] 3426 emission line is therefore undetected in that region. See Section 3.2 for details.
Other Images in This Article

Show More
Copyright and Terms & Conditions
© 2021. The American Astronomical Society. All rights reserved.