Image Details
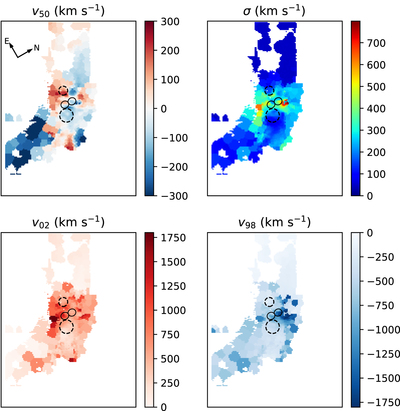
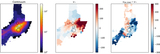
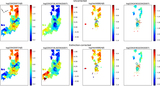
Caption: Figure 7.
Central velocity (v50), velocity dispersion (σ), maximum redshifted velocity (v02), and maximum blueshifted velocity (v98) of [O III] 5007. The color bars show the velocity in kilometers per second. The black dashed circles show the locations of the outflow regions, and the black solid circles show the locations of the “superbubble.” Regions of high σ > 250 km s−1 are observed along the direction of the bipolar superbubbles but extend to ∼5 kpc, approximately two to three times the previously reported size. Moderately broad emission with σ ∼ 150–250 km s−1 is observed in the outflow regions extending ∼5 kpc in the NE and SW directions. The larger-scale extended nebulae have a fairly uniform velocity dispersion, σ ∼ 100–150 km s−1 in the SW nebula and σ ∼ 50 km s−1 in the NE nebula.
Other Images in This Article

Show More
Copyright and Terms & Conditions
© 2021. The American Astronomical Society. All rights reserved.