Image Details
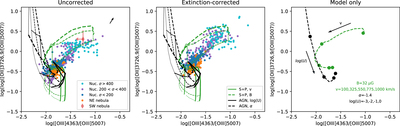
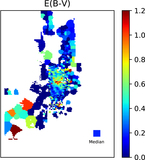
Caption: Figure 13.
Same as Figure 11 but for [O II] 3726, 9/[O III] 5007 vs. [O III] 4363/[O III] 5007 line ratios. The shock+precursor model grids overlap with most of the observed line ratios in all regions, while the AGN photoionization model only matches a fraction of the spaxels in the NE nebula and the slow spaxels in the nuclear region.
Other Images in This Article

Show More
Copyright and Terms & Conditions
© 2021. The American Astronomical Society. All rights reserved.
Copyright ©
2025 Astronomy Image Explorer. All Rights Reserved.