Image Details
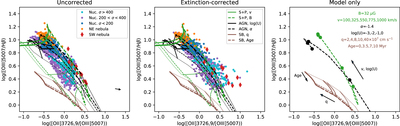
Caption: Figure 11.
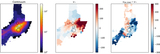
Diagnostic diagram of [O III] 5007/Hβ vs. [O II] 3726, 9/[O III] 5007. Left: line ratios before extinction correction overplotted with model grids. The red diamonds correspond to the SW nebula, the orange points correspond to the NE nebula, and the cyan, violet, and blue points correspond to the high-, medium-, and low-velocity spaxels in the nuclear region. The green grids show a shock+precursor ionization model with solar metallicity and a preshock density of 100 cm−3. The solid grid lines correspond to five shock velocity values (100, 325, 550, 775, and 1000 km s−1; thin to thick), while the dashed grid lines correspond to four magnetic field values (0.001, 1, 20, and 100 μG; thin to thick). The black grids show a dusty AGN ionization model with solar metallicity and a density of 100 cm−3. The solid grid lines correspond to five values of the ionization parameter ﹩\mathrm{log}(U)﹩ (−4, −3, −2, −1, and 0; thin to thick), while the dashed grid lines correspond to four values of the power-law index (−2, −1.7, −1.4, and −1.2; thin to thick). The brown grids show a starburst ionization model assuming standard mass loss and continuous star formation with solar metallicity and a density of 100 cm−3. The solid grid lines correspond to five values of the ionization parameter q (0.2, 0.4, 0.8, 1, and 4 × 10⁸; thin to thick), while the dashed grid lines correspond to four values of age (0, 3.5, 7, and 10 Myr; thin to thick). The black arrow in the left panel represents the median magnitude and direction of extinction correction on the line ratios. Middle: extinction-corrected line ratios overplotted with model grids. In the right panel, to allow for easier visualization of the trends of model parameters, we show model sequences without the observed data. The shock+precursor model is shown at a fixed magnetic field strength of 32 μG, and the AGN photoionization model is shown at a fixed power-law index of −1.4. The shock and AGN models overlap with each other, and both align with the observed line ratios. The starburst model cannot reproduce the observed line ratios in any region of the galaxy.
Other Images in This Article

Show More
Copyright and Terms & Conditions
© 2021. The American Astronomical Society. All rights reserved.