Image Details

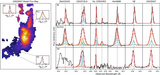
Caption: Figure 12.
Same as Figure 11 but for [O III] 4363/[O III] 5007 vs. He II 4686/Hβ line ratios. The shock+precursor model (green grids) successfully reproduces most of the observed line ratios, while the AGN photoionization model fails to account for most of the spaxels in the galaxy. The red arrow shows the median value of the 3σ upper limit in the SW nebula.
Other Images in This Article

Show More
Copyright and Terms & Conditions
© 2021. The American Astronomical Society. All rights reserved.
Copyright ©
2025 Astronomy Image Explorer. All Rights Reserved.